Usage
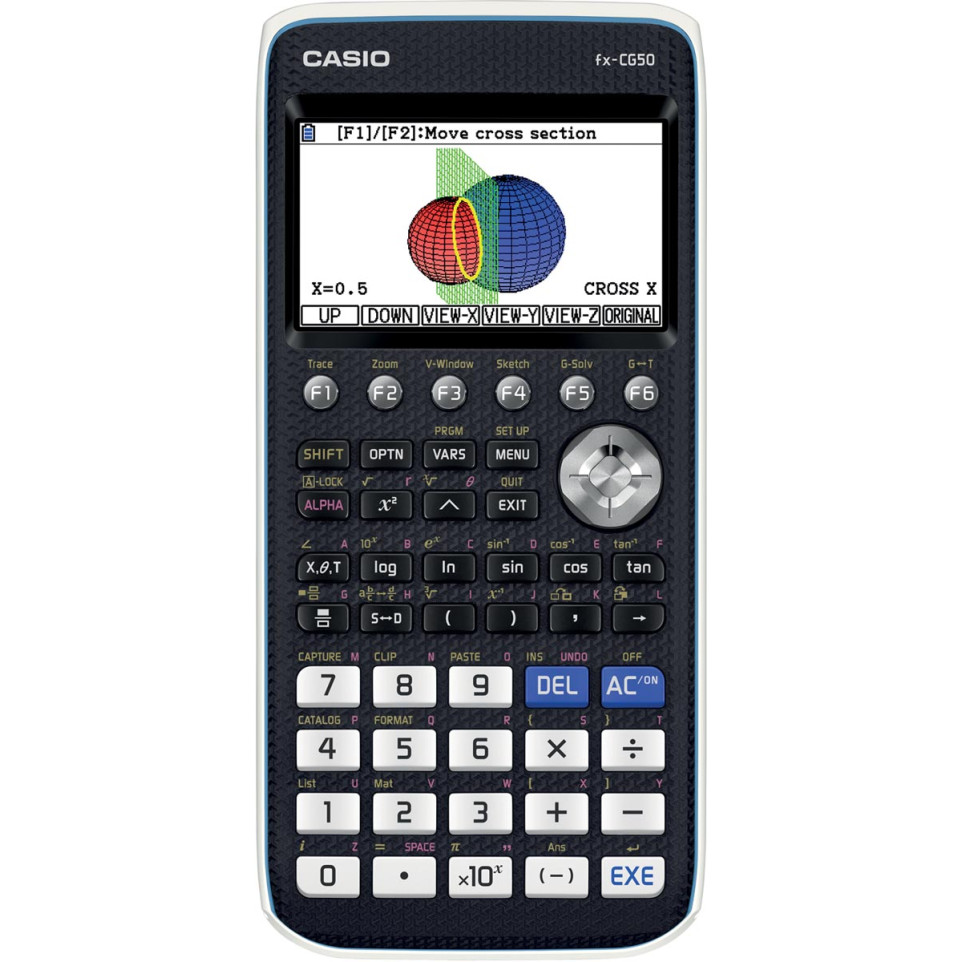
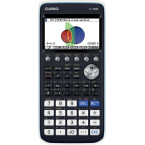
The Casio FX-CG50 graphing calculator is designed for advanced mathematics and science applications. It is suitable for secondary school, college, and university students who need to visualize complex equations and perform statistical or scientific calculations.
Advantages
- High-resolution color display (384 x 216 pixels) enhances graph clarity and interpretation.
- Draws up to three simultaneous 3D graphs, supporting visualization of lines, planes, spheres, and cylinders.
- User-friendly icon-based interface with Natural Textbook Display for intuitive input and result reading.
- Extensive mathematical functionality including statistics (regression analysis), calculus (integration/derivatives), matrices, vectors, programming capability (Python not included by default).
- No computer algebra system (CAS), which may be a drawback if symbolic computation is required for specific courses.[1][3][4][5]
Specifications
- Design: Robust plastic casing with slide-on hard cover; dot matrix LCD color display; dimensions: approximately 188.5 × 89.5 × 20.6 mm; weight: around 230 g.[3][8]
- Durability & Power: Powered by four AAA batteries; approximate battery life up to 140 hours with alkaline batteries.[1][4]
- Performance: Displays up to eight lines of text per screen; handles matrices up to size of at least (26 imes); supports nested parentheses levels up to twenty-six deep; user memory: ~61 KB RAM / ~16 MB storage memory.[3][4]
- Differentiators: Industry-first template-driven easy setup for various types of graphs including expressive formats (vector/point/express). Features direct data import via USB or serial port, Picture Plot software enabling graphical analysis directly on imported images.[1][7]
How it works
The Casio FX-CG50 operates via an icon-driven menu where users select functions like graphing or statistical analysis. Enter equations using the natural textbook format, then visualize data in color—whether plotting functions in two or three dimensions—using intuitive navigation buttons for zooming, rotating views, and analyzing results step-by-step.